

October 7, 2026
The confidence gap in financial literacy
Written by Dr. Jeffrey Dickinson
PISA 2022 · Financial confidence · 20 education systems · 15-year-olds
Similar skills. Less confidence.
Even when young women are highly financially literate, their confidence around matters relating to money and finance is low. Across the 20 education systems that took part in PISA's 2022 financial literacy assessment[1, p. 16], young women aged 15 report far less confidence than young men in handling everyday money matters: paying a bill, reading a bank statement, understanding a contract. This page looks at that gap alone: how large is the gap in confidence, how does it relate to other characteristics, and how does the confidence gap look between wealthy and poorer countries?
How big, and where
Every system, same direction
PISA's analysis of dealing with traditional money matters summarises how sure students feel about six tasks[1, p. 171][2, p. 405]. On average across the 20 systems, young men feel confident or very confident about 53% of the six tasks and young women about 40%, a gap of 12.3 percentage points[7]. PISA also asked about a separate set of five tasks done on a phone or computer, such as transferring money, paying by phone or keeping payment details safe. Interestingly, young women feel more confident about digital tasks than about the everyday ones: they feel sure about 58% of them, versus 40% of young women who feel confident with the six everyday tasks. Young men are also more confident about the digital tasks (65%), so the gap is smaller, at 6.8 points, but does not close; young men are still significantly more confident in 15 of the 20 systems[7].
See how young women and men answered each question, in every system →
Of course, no story I have ever analyzed related to economics is simple: among students who sat the test, young women score significantly higher than young men on financial literacy in three systems: Bulgaria, Malaysia and the United Arab Emirates[7]. Young men are still more confident in all three, although in Malaysia the confidence gap is too small to be statistically significant.
Young men feel confident about more of the tasks in every system
Each row shows the share of six everyday money tasks, such as paying a bill or understanding a bank statement, that young women and men say they would feel “confident” or “very confident” doing. The distance between the dots is the gap, printed on the right in percentage points (bold: statistically significant). Switch to see a separate set of five tasks done on a phone or computer.
Confidence and skill
Financially literate young women do not necessarily respond that they have higher levels of confidence
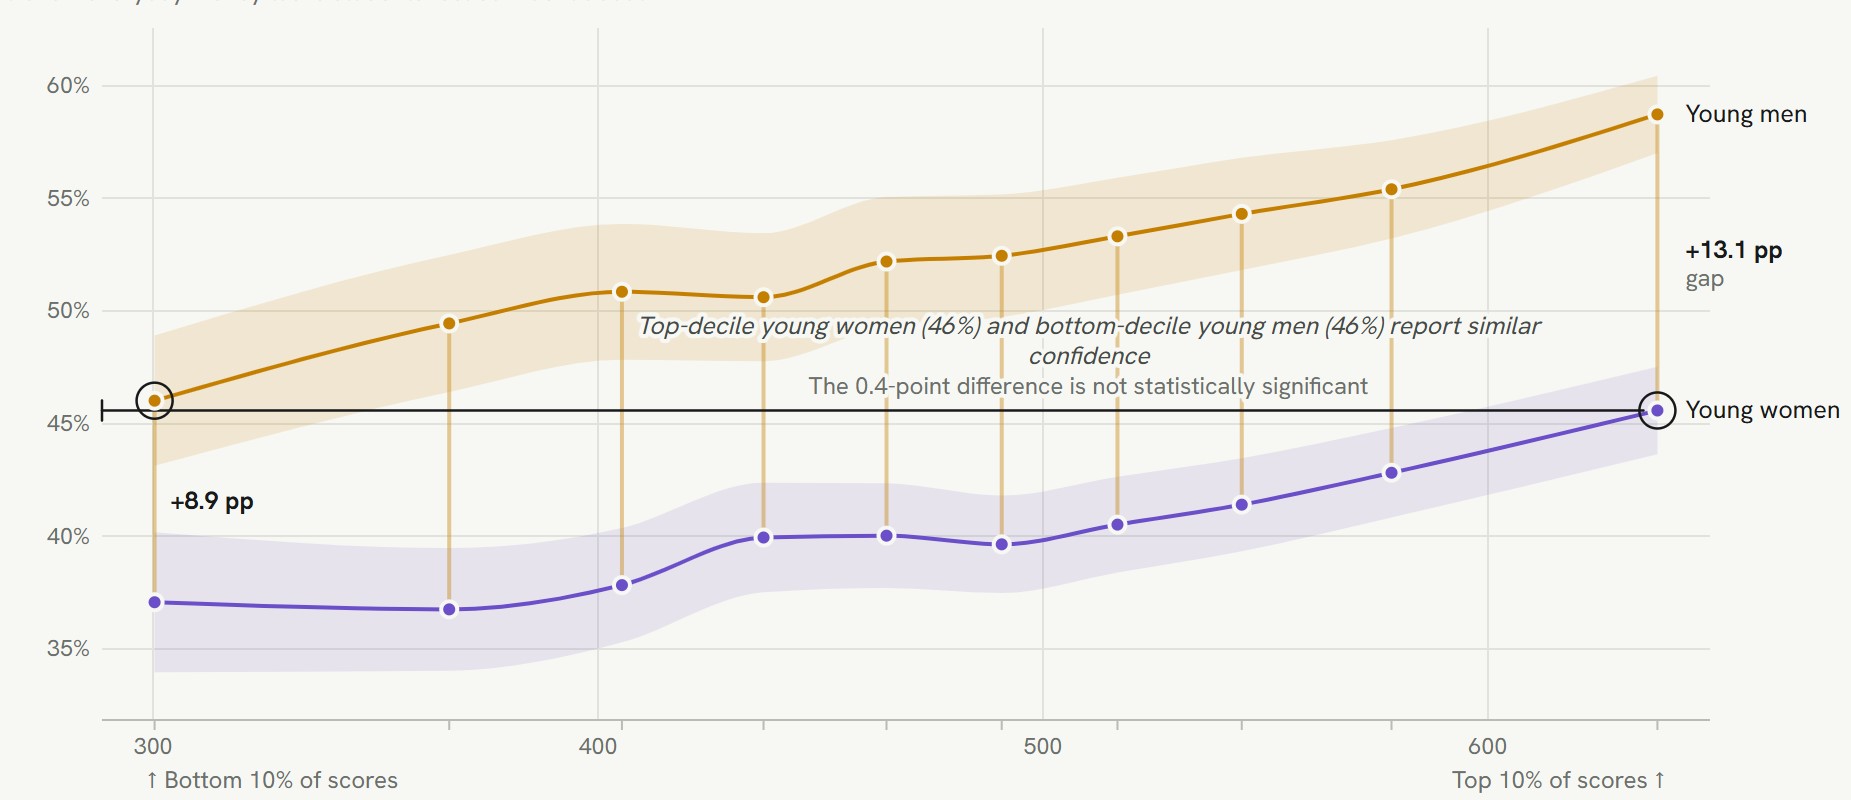
If financial literacy and confidence mirror each other, the confidence gap would shrink when young men and women with the same financial literacy score are compared. It does not: holding the score equal leaves the average gap at 12.2 percentage points[7]. From the lowest-scoring tenth of students to the highest, the share of tasks young men feel confident about rises by 13 points (46% to 59%) but young women's by only 9 (37% to 46%).
Interestingly, the gap in confidence between young men and young women is very small on the confidence regarding "managing my money." You can see this by clicking the different question items in the figure below.
Skill rises; young women's confidence barely follows
Share of the money tasks young men and women feel confident about, by financial literacy decile within country. Bands: 95% confidence intervals.
Even where young women score higher, young men feel more confident
Each system placed by its score gap (across) and its confidence gap (up). No system falls below the line where young women would be the more confident group.
Family background and national income
Higher levels of parental education = wider gap
This section groups students by the highest level of education either parent completed (PISA's variable HISCED)[3]. On average the three groups are about the same size: parents with secondary school or less (35% of students), parents with a bachelor's or short tertiary degree (30%), and parents with a master's or doctorate (35%)[7]. Costa Rica has no parental education data, so these averages cover 19 systems.
The share of tasks young men feel confident about rises from 50% when neither parent received education beyond secondary school to 55% when a parent holds a master's or doctorate. Young women's share rises only from 39% to 41%, and not at all between the top two groups. The gender gap therefore grows from 11.1 to 14.6 percentage points, a statistically significant widening of 3.4 points (95% confidence interval 1.1 to 5.7). It is significantly wider at the top than at the bottom in 4 of the 19 systems, and narrower in none[7]. PISA's broader index of family background, which also counts parents' occupations and possessions at home[2, p. 401], shows a steeper version of the same pattern: across its quarters the gap grows from 9.9 to 15.8 points[7]. These are associations in cross-sectional data; they do not show that family background causes the difference.
The gap grows with parents' education
Young men's minus young women's share of the six everyday money tasks they feel confident about, in percentage points, by the highest education of either parent. Shaded band: 95% confidence interval of the gap.
Interestingly, wealthier countries in GDPPC tend to have wider confidence gaps: across the 20 countries the gap is about 2.8 percentage points larger for each doubling of GDP per capita[7][8]. Malaysia, Bulgaria and Brazil have some of the smallest gaps; Denmark, Hungary and Norway some of the largest. Saudi Arabia is the clearest exception: about as rich as Austria, with one of the smallest gaps. As a reminder, the chart shows a pattern; this does not establish a causal relationship.
Richer systems tend to have larger confidence gaps
Each system's confidence gap (percentage points of six money tasks) against its GDP per capita in 2022, on a logarithmic scale.
Take-away
What this means for Dollar Scholars
The main take-away for us at Dollar Scholars is that financial literacy will never be the end-all solution to poverty or to helping people improve their lives. There are multiple overlapping dynamics that individuals must react to beyond just financial literacy. Although we are strictly focused on financial literacy, that is why Dollar Scholars has to take the time to understand the latest research, and understand what other possible issues might be affecting Dollar Scholars students who want to improve their financial well-being.
AppendixEvery question, every system
Students were asked if they would feel confident doing six everyday tasks related to money, such as paying a bill or understanding a bank statement, and five tasks on a digital device, each on a four-point scale[1, p. 171][3]. Choose a question to see how young women and men answered in each system. Bars are lined up at the boundary between "not very confident" and "confident", so the length to the right of the line is the share who feel confident. Systems are sorted by the gap; the gap is in bold where it is statistically significant (5% level).
How young women and men answered each question
Percent of students giving each answer; upper bar young women, lower bar young men. Gap: young men minus young women in the share answering "confident" or "very confident", in percentage points.
MethodsHow these numbers were made
Where the confidence measure comes from
- The financial literacy questionnaire, about ten minutes long, was given to every participating student in the systems that took the financial literacy assessment[2, p. 93]. Question FL162 asked how confident students would feel making a money transfer, filling in forms at a bank, understanding bank statements, understanding a sales contract, keeping track of an account balance and planning spending (4-point scale)[1, p. 171].
- This page measures confidence as the share of the six tasks a student answers "confident" or "very confident" (students who answered all six), and gaps as young men's share minus young women's share in percentage points. The digital measure does the same for question FL163's five tasks on a digital device. OECD instead scales the answers into the indices FLCONFIN and FLCONICT (mean 0, SD 1 across OECD countries)[2, p. 405]; an index has no natural zero, so a percentage difference in it would be meaningless. Both measures give the same picture: young men more confident in every system[1, Table IV.B1.7.20][7].
Where the financial literacy scores come from
- The scores are OECD's own[3]; the domain is defined in the assessment framework[6]. In systems taking the financial literacy option, PISA sampled about 1,650 additional students in the same schools[2, p. 105]. Software randomly assigned students to two-hour test forms; the financial literacy forms combine one hour of financial literacy with one hour of maths or reading[2, p. 38, Table 2.7]. Item-level answers are in file CY08MSP_FLT_COG.
- OECD scaled the answers with an item-response model and drew 10 plausible values per student (PV1FLIT–PV10FLIT) from a latent regression model fitted with DGROUP; students not given financial literacy items receive plausible values estimated from their other answers and background[2, pp. 232–233]. This page uses all 10 values, as OECD recommends[4].
Estimation
- Sample: every estimate on this page uses only the students who were given a financial literacy test form (forms 67–74), 42,154 students in the 20 systems[2, p. 38, Table 2.7]. Forms were assigned at random, so these students represent the same population as the full sample; their financial literacy scores rest on their own answers to financial literacy items rather than on estimates from their other answers[2, pp. 232–233]. Results for all students are very similar[7].
- Estimates use the final student weight[2, p. 189, Formula 10.1] and 80 replicate weights built with Fay's variant of balanced repeated replication[2, p. 196][4]. Results across plausible values are combined with Rubin's rules[5]. Gaps are young men minus young women, computed within each replicate.
- Averages are the mean of the 20 participating systems, so each system counts equally[1, p. 16]. OECD's own reports also give an "OECD average" over the 14 OECD members; it is not used here.
Caveats
- Confidence is self-reported. In these data young men choose the highest answer category more often on every attitude item, so part of the gap may be response style; the OECD indices, which weight every answer category, show the same pattern[7].
- Young men leave the financial questionnaire blank more often than young women (12% against 7% of test-takers on its first question), typically clicking through each screen in under two seconds, and those students score lower; confidence results therefore describe respondents[7].
- Belgium is represented by its Flemish Community and Canada by eight provinces; Denmark, the Netherlands, the United States and the Canadian provinces did not meet PISA sampling standards (*)[1, pp. 14, 16, 174].
Sources
References
- OECD (2024). PISA 2022 Results (Volume IV): How Financially Smart Are Students? PISA, OECD Publishing, Paris. https://doi.org/10.1787/5a849c2a-en. Page numbers refer to the printed pagination; tables numbered IV.B1.x are in Annex B1.
- OECD (2024). PISA 2022 Technical Report. PISA, OECD Publishing, Paris. https://doi.org/10.1787/01820d6d-en.
- OECD (2024). PISA 2022 Database, financial literacy student files CY08MSP_FLT_QQQ (questionnaire, scores and weights) and CY08MSP_FLT_COG (test items). https://www.oecd.org/en/data/datasets/pisa-2022-database.html.
- OECD (2009). PISA Data Analysis Manual: SPSS, Second Edition. PISA, OECD Publishing, Paris. https://doi.org/10.1787/9789264056275-en. Methods for replicate weights and plausible values.
- Rubin, D. B. (1987). Multiple Imputation for Nonresponse in Surveys. New York: John Wiley & Sons.
- OECD (2023). PISA 2022 Assessment and Analytical Framework. PISA, OECD Publishing, Paris. https://doi.org/10.1787/dfe0bf9c-en. Definition of the financial literacy domain.
- Own calculations from the PISA 2022 database[3], following the methods of [2] and [4]. Analysis scripts and full results (all-student and test-taker-only samples, and the comparison with OECD Table IV.B1.7.20) are in the author's analysis folder:
gender_gap_analysis/code/confidence_deep_dive/analysis.py,share_measures.py,results/confidence_deep_dive/share_results.jsonandshare_results_takers.json(percentage-point measures),results.jsonandresults_takers.json(OECD indices); this page uses the test-taker files, plusped_results_takers.json,gdp_results_takers.json,item_dist_takers.jsonandtakers_extra.json(score gaps and deciles), andcode/design_checks/for the questionnaire non-response analysis. - World Bank (2026). World Development Indicators: GDP per capita, PPP (current international $), indicator NY.GDP.PCAP.PP.CD, 2022 values (database last updated 13 July 2026; retrieved 7 October 2026). https://data.worldbank.org/indicator/NY.GDP.PCAP.PP.CD.